CLASS-11
RELATION & FUNCTION - ABSOLUTE VALUE FUNCTION
ABSOLUTE VALUE FUNCTION -
Example.1) The absolute value function y = f(x) =│x│
Ans.) The domain consists of all real numbers, but the range is made up of all non-negative real numbers. The graph is shown in below figure -
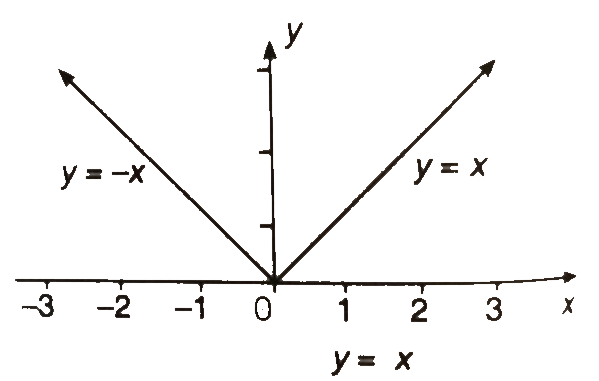
When x ≥ 0, y =│x│is equivalent to y = x, the equation of the straight line through the origin with slope 1. When x < 0, y =│x│is equivalent to y = -x, the equation of the straight line through the origin with slope -1.
Example.2) Draw the graph of the function f(x) = │x - 1│
Ans.) The domain is the set of all real numbers. The range is the set of all non-negative real numbers.
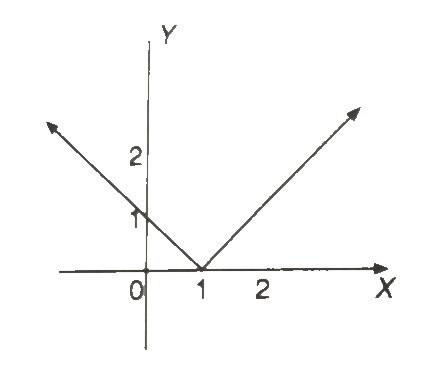
The graph is the graph of y =│x│ shifted one unit to the right. (Ans.)
Example.3) Draw the graph of the function f(x) = - x│x│.
Ans.) If x > 0, then y = f(x) = - x . x = - x²,
So, y = - x², for x > 0 ..........(i)
If, x = 0, then y = f(x) = 0,
So, y = f(x) = 0, for x = 0 ............(ii)
If, x < 0, then y = f(x) = (- x) (- x) = x²,
so, y = f(x) = x² for x < 0 .................(iii)
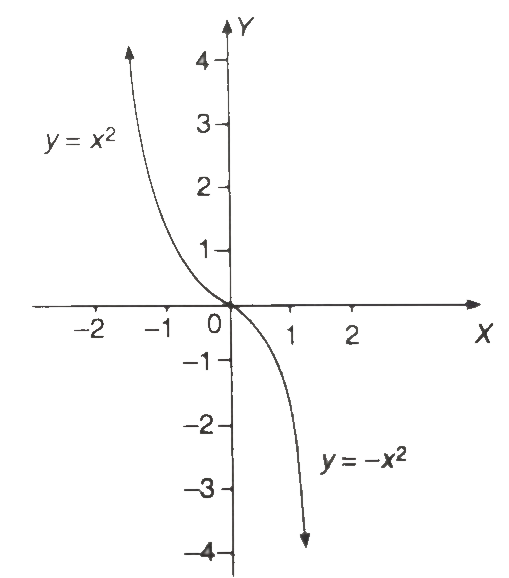
From (i), as x ⟶ ∞, y = - ∞ for x > 0.
From (iii), as x ⟶ - ∞, y ⟶ ∞ for x < 0,
From (ii), y = f(x) = 0
Example.4) Draw the graph of the following functions
│x│
(i) f(x) = ------, (ii) f(x) = │x│+│x - 1│
x
Ans.) (i) The domain is the set of all non-zero real numbers. The graph is the right half of the line y = 1 for x > 0, plus the left half of the line y = - 1 for x < 0.
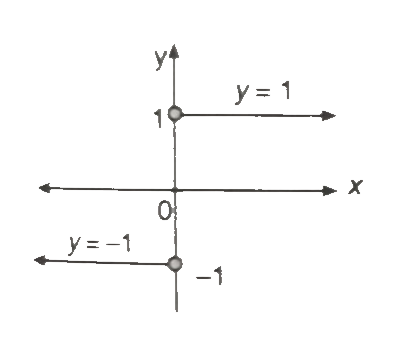
The range is {1, -1}. The graph is not defined for x = 0.
(ii) Case.1) x ≥ 1, then f(x) = x + x - 1 = 2x - 1.
Case.2) 0 ≤ x < 1, then f(x) = x - (x - 1) = 1.
Case.3) x < 0, then f(x) = - x - (x - 1) = - 2x + 1.

So, the graph consists of a horizontal line segment and two half-lines.
Example.5) Draw the graph of the function y =│x - 2│+│x - 3│
Ans.)
y = │x - 2│+│x - 3│
Here, we consider separate intervals.
When x > 3, (x - 2), (x - 3) both will be positive,
therefore,
y = x - 2 + x - 3
=> y = 2x - 5
Some points of the graph are -

When, x = 3, y = │x - 2│+│x - 3│
= │3 - 2│+│3 - 3│ = 1
When, x = 2, y = │x - 2│+│x - 3│
= │2 - 2│+│2 - 3│ = 1
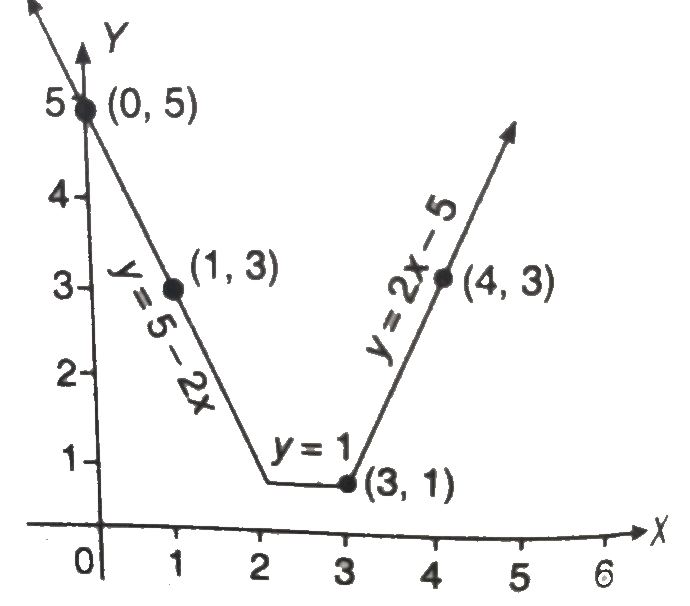
and if 2 < x < 3 then (x - 2) will be positive and (x - 3) will be negative, thus,
y = (x - 2) - (x - 3) = 1
so, for 2 ≤ x ≤ 3, y = 1 (a line parallel to the x-axis)
Now, if x < 2, in this case both (x - 2) and (x - 3) will be negative and, therefore, y = - (x - 2) - (x - 3) = 5 - 2x.
Some points on the line y = 5 - 2x for x < 2 are -
