CLASS-6
PLOTTING POINT ON EXPRESSION
PLOTTING POINT ON EXPRESSION -
If you want to plot points on graph paper and label them with an expression or name, you can manually follow these steps. Let's assume you have a set of points and want to label them with corresponding expressions:
Steps to Plot Points on Graph Paper with Expressions:-
- Prepare Graph Paper:- Ensure you have graph paper. Each small square typically represents one unit on the coordinate plane.
- Draw Axes:- Use a ruler to draw the x-axis (horizontal) and y-axis (vertical) on the graph paper. Make sure they intersect at the origin (0, 0).
- Label Axes:- Label the x-axis and y-axis with appropriate values. For example, label every 1, 2, 3, etc., unit on each axis.
- Identify Points and Expressions:- For each point you want to plot, identify the (x, y) coordinates and the corresponding expression or name.
- Mark Points:- Use a pencil or pen to make a small dot or mark at the exact location of each point.
- Write Expressions/Names:- Near each dot, write the expression or name corresponding to that point.
- Connect Points (Optional):- If the points form a pattern or a sequence, you can connect them with a straight line.
- Add Title (Optional):- You can add a title to your graph if it represents a specific set of data.
- Grid Lines (Optional):- If your graph paper has grid lines, they can be helpful for better visualization.
- Scale (Optional):-
- If you want to maintain a specific scale, make sure each unit on the graph paper corresponds to a specific value.
Here's a simple example:-
Suppose you have points A (1, 3), B (2, 5), and C (3, 2), and you want to label them with expressions "Point A," "Point B," and "Point C" respectively. You would mark each point on the graph paper and write the corresponding expressions near the dots.
Remember, this method is manual and lacks the precision of digital tools, but it's suitable for simple visualizations on paper. If you have access to a computer or tablet, using graphing software or apps can provide a more accurate and versatile solution for plotting points with expressions.
There are a expression is given below with example for better understanding -

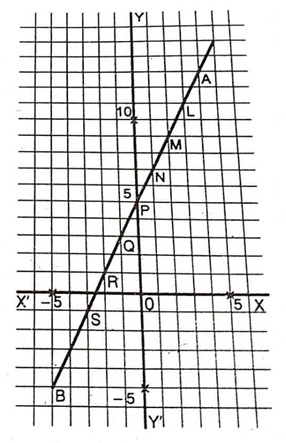
We now return to the expression, (2x + 5) discussed in the given picture. Using the same values of 'x' as before, and putting y to represent the value of the expression. We have the following table of values -

If, we now plot the points given by each pair of values we mark L, M, N, P, Q, R, S in the adjoining figure.

It will seen that, they all lie on a straight line. This line may be produced in either direction, and is called the graph of the expression (2x + 5).
Since y is always equal to (2x + 5), the variation of this expressions are seen at figure.