CLASS-6
GRAPHS - PLOTTING POINTS
GRAPHS - PLOTTING POINTS -
Plotting points on a graph is a fundamental concept in mathematics and data visualization. The process involves representing individual data points on a coordinate system, typically using the Cartesian coordinate system with an x-axis and a y-axis. Here's a general guide on how to plot points on a graph:
Steps to Plot Points on a Graph:-
Example:-
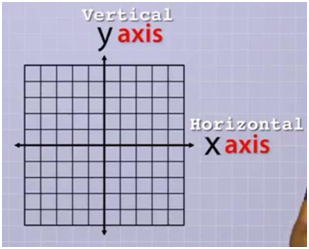
- Understand the Coordinate System:- The x-axis is the horizontal axis, and the y-axis is the vertical axis. The origin (0,0) is the point where the x-axis and y-axis intersect.
- Identify Data Points:- Each data point should have a corresponding ordered pair (x, y).
- Draw the Axes:- Draw the x-axis and y-axis on your graph paper or plotting area.
- Scale the Axes:- Assign a scale to the axes based on the range of your data. Mark off equal intervals to make measurements more accurate.
- Plot the Points:- For each data point, find its corresponding position on the graph by locating the x-value on the x-axis and the y-value on the y-axis. Place a dot or mark at that position.
- Connect the Points (Optional):- If the points represent a series or a pattern, you might connect them with a line to visualize trends.
- Label the Points (Optional):- If necessary, label each point with its coordinates (x, y) or any other relevant information.
- Add Titles and Labels (Optional):- Include titles for the graph, and label the x and y axes to provide context and clarity.
Manual Plotting:-
If you prefer to plot points manually on graph paper:-
- Draw a set of perpendicular axes.
- Choose a scale for each axis.
- Locate each point based on its (x, y) coordinates.
- Mark the points on the graph.
Remember that the method may vary based on the specific tools or programming languages you are using. Most programming languages and graphing tools have similar functions or methods for plotting points on a graph.
Let's say you have two points:- A(2, 3) and B(-1, 4).
- Draw the x-axis and y-axis.
- Scale the axes based on the range of your data.
- Locate point A at (2, 3) and mark it on the graph.
- Locate point B at (-1, 4) and mark it.
- Optionally, connect the points with a line to visualize the relationship.
- Optionally, label the points with their coordinates.
- Add titles and labels if needed.
These 2 numbers are called coordinates. Thus, number plane is referred as coordinate plane as they are of the same order.
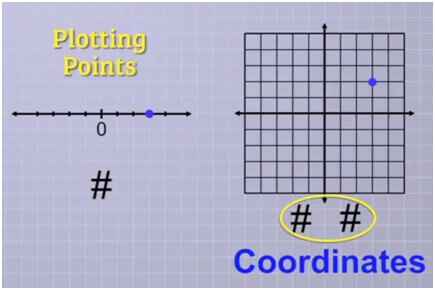
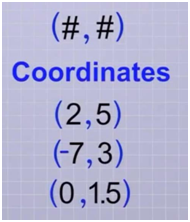
Co- ordinates use a special format. These 2 numbers are inside parenthesis with a comma to separate them. for example (2 ,5); (-7,3) etc..
Co-ordinate plane is formed by combining two perpendicular number lines. Each one of these number lines are called axis. The horizontal number line is called x-axis and the vertical number line is y-axis.

The first co-ordinate number listed will be ‘x’ and the second co-ordinate number will be ‘y’. we write them as (x, y). The two numbers in an ordered pair together define a s ingle point.
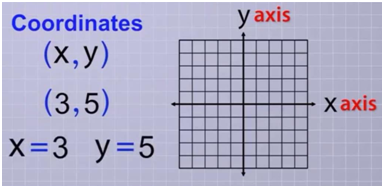
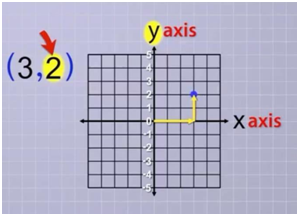
Top lot the co-ordinate son the graph, we start from the origin o f the co-ordinate plane and move to the point s in x direction and then to the y direction.
Let us consider few examples (3, 2), (-4, 3), (-3, -3), (4, -2.5)
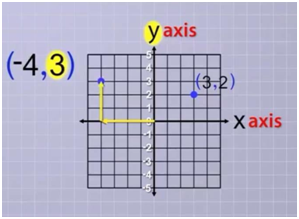
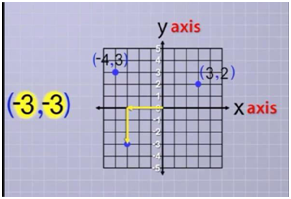

As we have plotted all the points we can see that all these co-ordinates are in the different region s of the co-ordinate place.
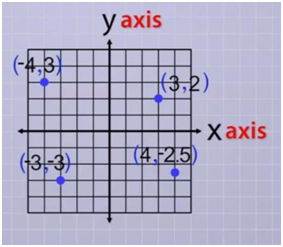
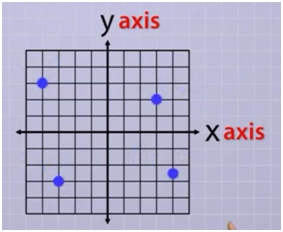
These four regions are called Quadrants and their boundaries are defined by two axes.
If you're using software for plotting points, such as graphing calculators, spreadsheet programs, or programming languages like Python with libraries like Matplotlib, the process involves using specific functions or commands to plot the points and customize the graph.