CLASS-6
PLOTTING POINTS ON PAPER
PLOTTING POINTS ON PAPER -
If you want to physically plot points on paper (offline), you can follow these manual steps. In this case, you won't be using any programming language or graphing software; instead, you'll use a ruler, a pencil, and possibly graph paper.
Steps to Plot Points on Paper:-
- Prepare Graph Paper:- If you have graph paper, it's helpful. Each small square typically represents one unit on the coordinate plane.
- Draw Axes:- Use a ruler to draw the x-axis (horizontal) and y-axis (vertical) on the graph paper. Make sure they intersect at the origin (0, 0).
- Label Axes:- Label the x-axis and y-axis with appropriate values. For example, you might label every 1, 2, 3, etc., unit on each axis.
- Identify Points:- For each point you want to plot, locate the corresponding (x, y) coordinates on the graph paper.
- Mark Points:- Use a pencil or pen to make a small dot or mark at the exact location of each point.
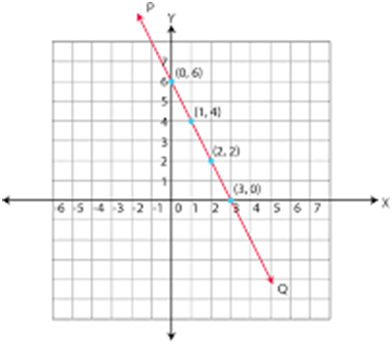
- Connect Points (Optional):- If the points form a pattern or a sequence, you can connect them with a straight line.
- Label Points (Optional):- If needed, write the coordinates of each point near the dot.
- Add Title (Optional):- You can add a title to your graph if it represents a specific set of data.
- Grid Lines (Optional):- If your graph paper has grid lines, it can be helpful for better visualization.
- Scale (Optional):-
- If you want to maintain a specific scale, make sure each unit on the graph paper corresponds to a specific value.
Remember that these steps are manual and may lack the precision and flexibility of digital plotting tools, but they are suitable for simple visualizations on paper. If you have access to a computer or tablet, using graphing software or apps can provide a more accurate and versatile solution for plotting points.
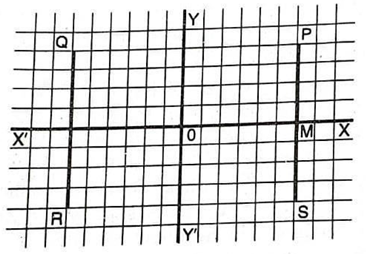
On a piece of square paper, select a pair of thicker horizontal and vertical lines. Let these be marked XOX', YOY' as in shown below. Then the position of any point 'P' with reference to these lines can be found when we know it's distances from each of them. Such lines are known as axes of reference, XOX' being known as the axis of x, and YOY' being known as the axis of y. Their point of intersection O is called the origin.

Consider the point 'P' in the figure. It will be seen that, we can get to P by making 6 divisions of the paper along OX, that is to the point 'M', and then taking 4 divisions vertically up from 'M'. Thus if the perpendicular distances of a point from the axes are known the position of the point is fixed. The distance 6 & 4 are known as the coordinates of the point 'P'. OM is known as the abscissa of 'P', and PM is known as Ordinate of P.
When symbol are used to abscissa is always denoted by x, and ordinate by y. A point whose coordinates are x & y is spoken of as "the point (x, y)," the abscissa of the point always being named first. The process of making the position of a point by means of it's coordinates is known as 'plotting the point'.
