CLASS-6
PRESENTATION OF PICTOGRAPH
PRESENTATION OF PICTOGRAPH -
Pictographs are a visual representation of data using symbols or pictures to convey information. They are a form of data visualization that can make complex information more accessible and understandable. Here's a breakdown of how you might structure your presentation:
Slide 1: Introduction :-
- Title: "Understanding Pictographs: Visualizing Data Through Symbols"
- Briefly explain the purpose of the presentation: To explore the concept of pictographs, understand their significance, and learn how to create and interpret them.
Slide 2: What are Pictographs? :-
- Definition: Pictographs are a type of data visualization that uses simple icons or symbols to represent quantities or categories.
- Highlight their historical significance: Pictographs have been used since ancient times to communicate information before the advent of written language.
Slide 3: Advantages of Pictographs :-
- Clarity and Accessibility: Pictographs simplify complex data and make it easier for people to understand.
- Universal Language: Pictographs can often be understood across cultures and languages.
- Engaging: Visual elements capture attention and encourage viewer engagement.
Slide 4: Elements of a Pictograph :-
- Symbol: The visual representation used to convey information.
- Key or Legend: An explanation of what each symbol represents.
- Data Set: The actual data that the pictograph is based on.
Slide 5: Creating a Pictograph :-
- Step-by-step guide:Choose a topic and data to visualize.Select symbols that are relevant and easy to understand.Create a key or legend that associates symbols with data values.Arrange the symbols according to the data.Title and label your pictograph appropriately.
Slide 6: Interpreting a Pictograph :-
- Discuss how to read a pictograph:Look at the symbols and their corresponding values in the key.Count the number of symbols to determine quantities.Analyze trends and patterns, such as which symbols appear most frequently.
Slide 7: Examples of Pictographs :-
- Show a few examples of pictographs from different contexts (e.g., education, health, sports) to illustrate their versatility and application.
Slide 8: Dos and Don'ts :-
- Dos: Keep symbols consistent, use appropriate scaling, ensure clarity, and provide a clear key.
- Don'ts: Overcomplicate symbols, use misleading scales, omit legends, or distort the data.
Slide 9: Real-World Applications :-
- Explain how pictographs are used in various fields, such as:Education: Teaching children basic math concepts.Marketing: Visualizing survey results for product preferences.Environment: Showing wildlife population trends.
Slide 10: Conclusion :-
- Summarize the key points discussed in the presentation.
- Emphasize the importance of pictographs in making data more accessible and engaging.
- Encourage the audience to explore using pictographs for their data visualization needs.
Slide 11: Q&A :-
- Allocate time for questions from the audience to address any queries they might have about pictographs.
Remember to use visual elements effectively in your presentation and keep the content concise and engaging. Good luck with your presentation on pictographs!
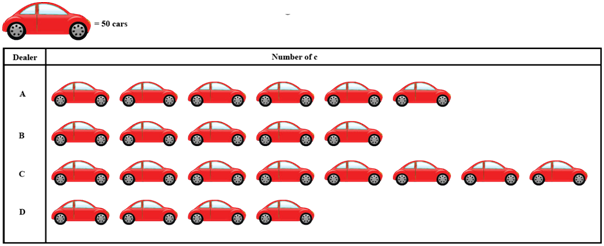
Example.1) The following pictograph shows the number of cars sold by four dealers A,B,C and D in a city. Scale: 1 car image = 50 cars

Using the pictograph, drawn above, answer the following question :
(i) How many more cars has dealer A sold as compared to dealer D ?
(ii) What is the total number of cars sold by all the dealers ?
Using the pictograph, shown above, answer the following question: How many more cars has dealer A sold as compared to dealer D?
Ans.) A sold cars = (50 X 6) = 300 cars [1 car pic = 50 cars]
D sold cars = (50 X 4) = 200 cars [1 car pic = 50 cars]
So, dealer A sold as compared to dealer D = (A - D)
= (300 - 200)
= 100 cars .....(i) (Ans.)
Dealer A sold = (50 X 6) = 300 cars [1 car pic = 50 cars]
Dealer B sold = (50 X 5) = 250 cars [1 car pic = 50 cars]
Dealer C sold = (50 X 8) = 400 cars [1 car pic = 50 cars]
Dealer D sold = (50 X 4) = 200 cars [1 car pic = 50 cars]
Car sold by all dealers = A + B + C + D
= 300 + 250 + 400 + 200
= 1150 cars .................(ii) (Ans.)
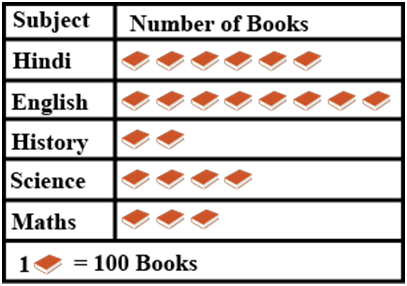
Example.2) The pictograph shows different subject books which are kept in a library. Observe the graph and answer the following questions.

How many English books are there in the library?
Ans.) English books are there in the said library -
8 pic of books X 100 books [1 pic of book = 100 books]
= 800 books (Ans.)
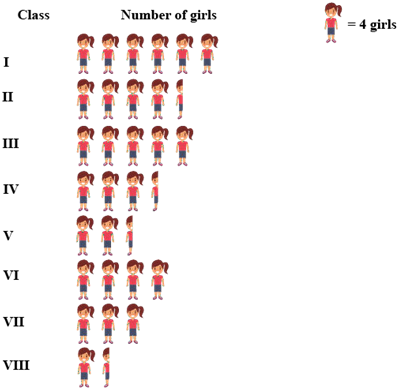
Example.3) The number of girl students in each class of co-ed. Middle school is depicted by the following pictograph:

Observe the above pictograph and answer the following questions: How many girls are there in VII class?
What is the total number of girls in co-ed. Middle school ?
Ans.) The number of girls are there in VII class => (3 X 4)
= 12 girls
Number of girls in Class I = (6 X 4) = 24 girls
Number of girls in Class II = (4 X 4) + (4 X 1/2) = (16 + 2) = 18 girls
Number of girls in Class III = (5 X 4) = 20 girls
Number of girls in Class IV = (3 X 4) + (4 X 1/2) = (12 + 2) = 14 girls
Number of girls in Class V = (2 X 4) + (4 X 1/2) = (8 + 2) = 10 girls
Number of girls in Class VI = (4 X 4) = 16 girls
Number of girls in Class VII = (3 X 4) = 12 girls
Number of girls in Class VIII = (1 X 4) + (4 X 1/2) = (4 + 2) = 6 girls
Total girls of that school from Class I to Class VIII -
(24 + 18 + 20 + 14 + 10 + 16 + 12 + 6) = 120 girl students (Ans.)